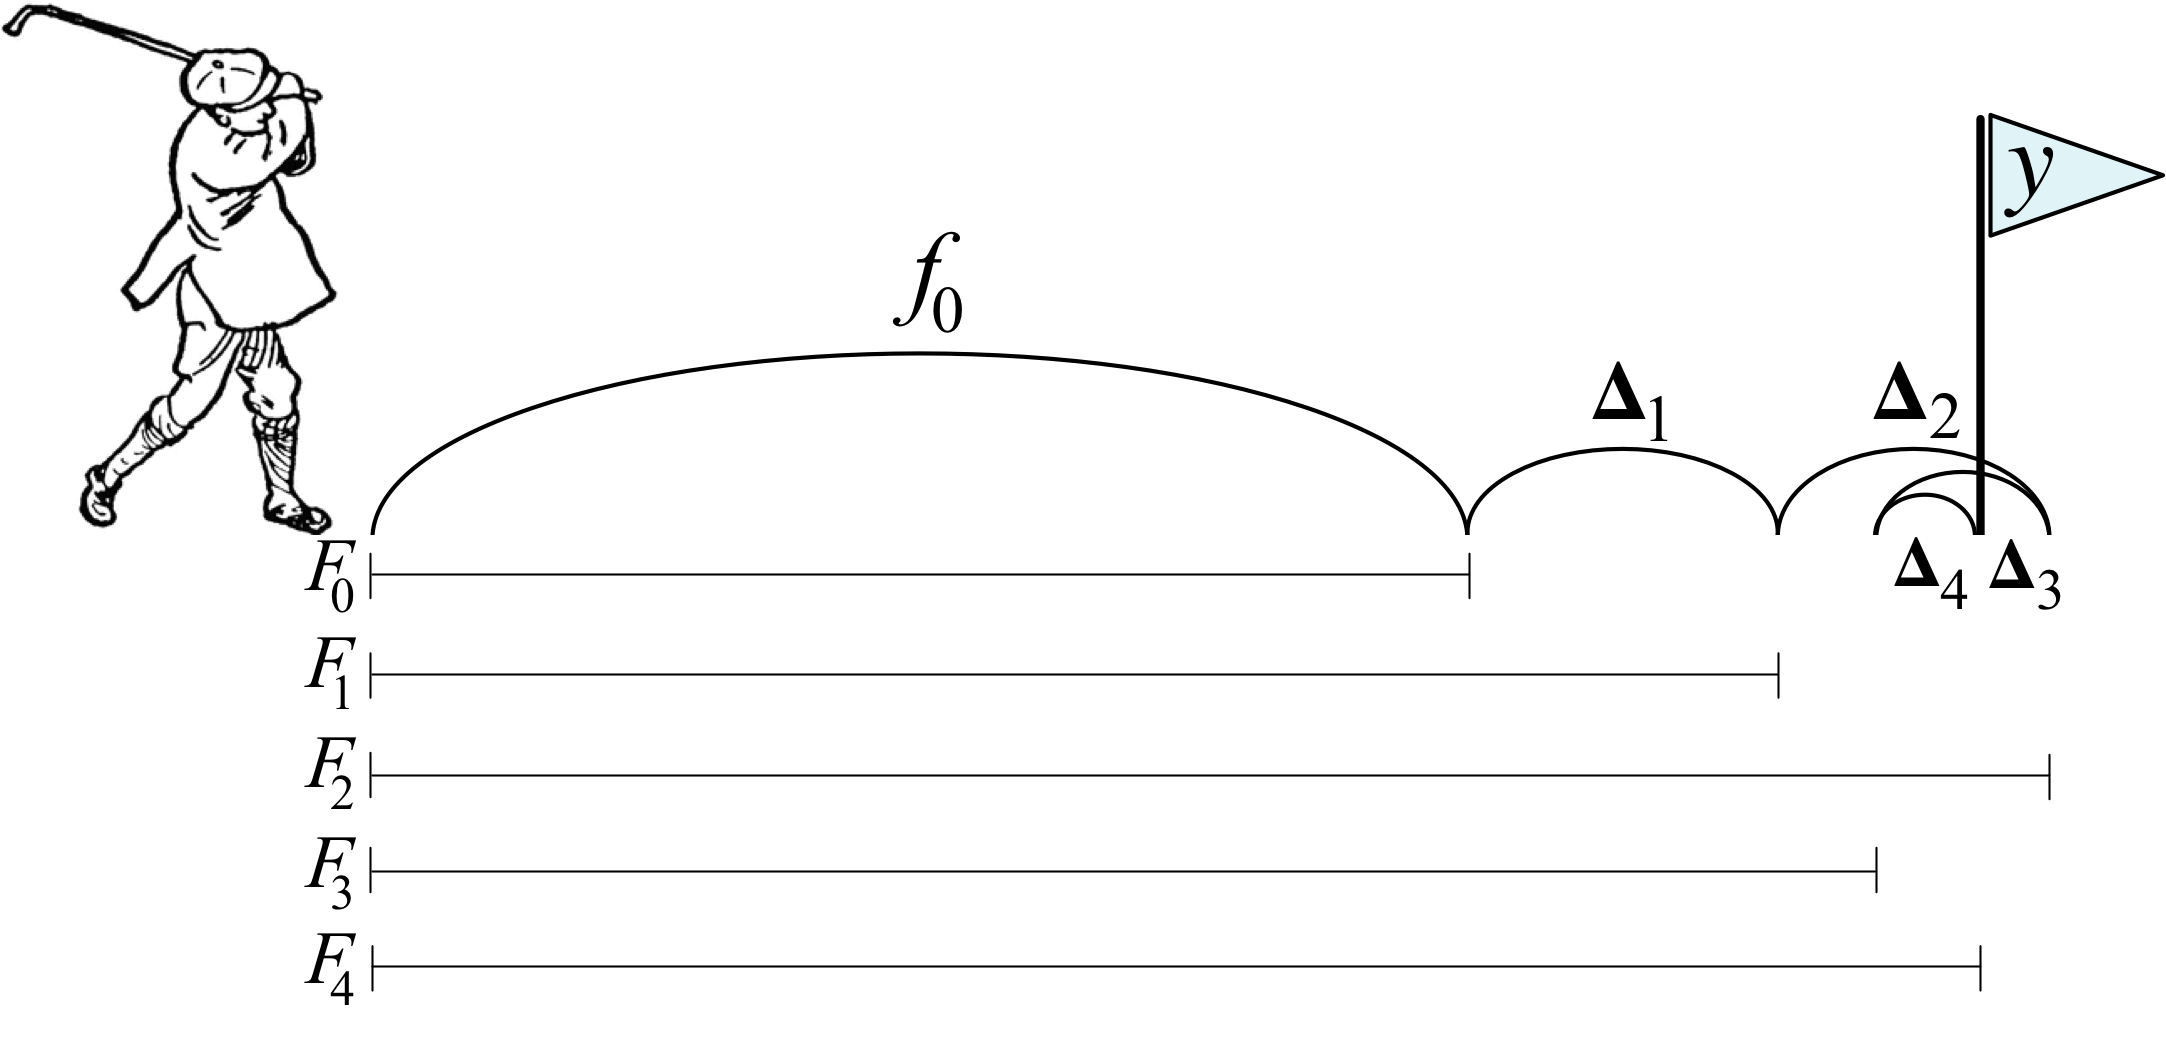
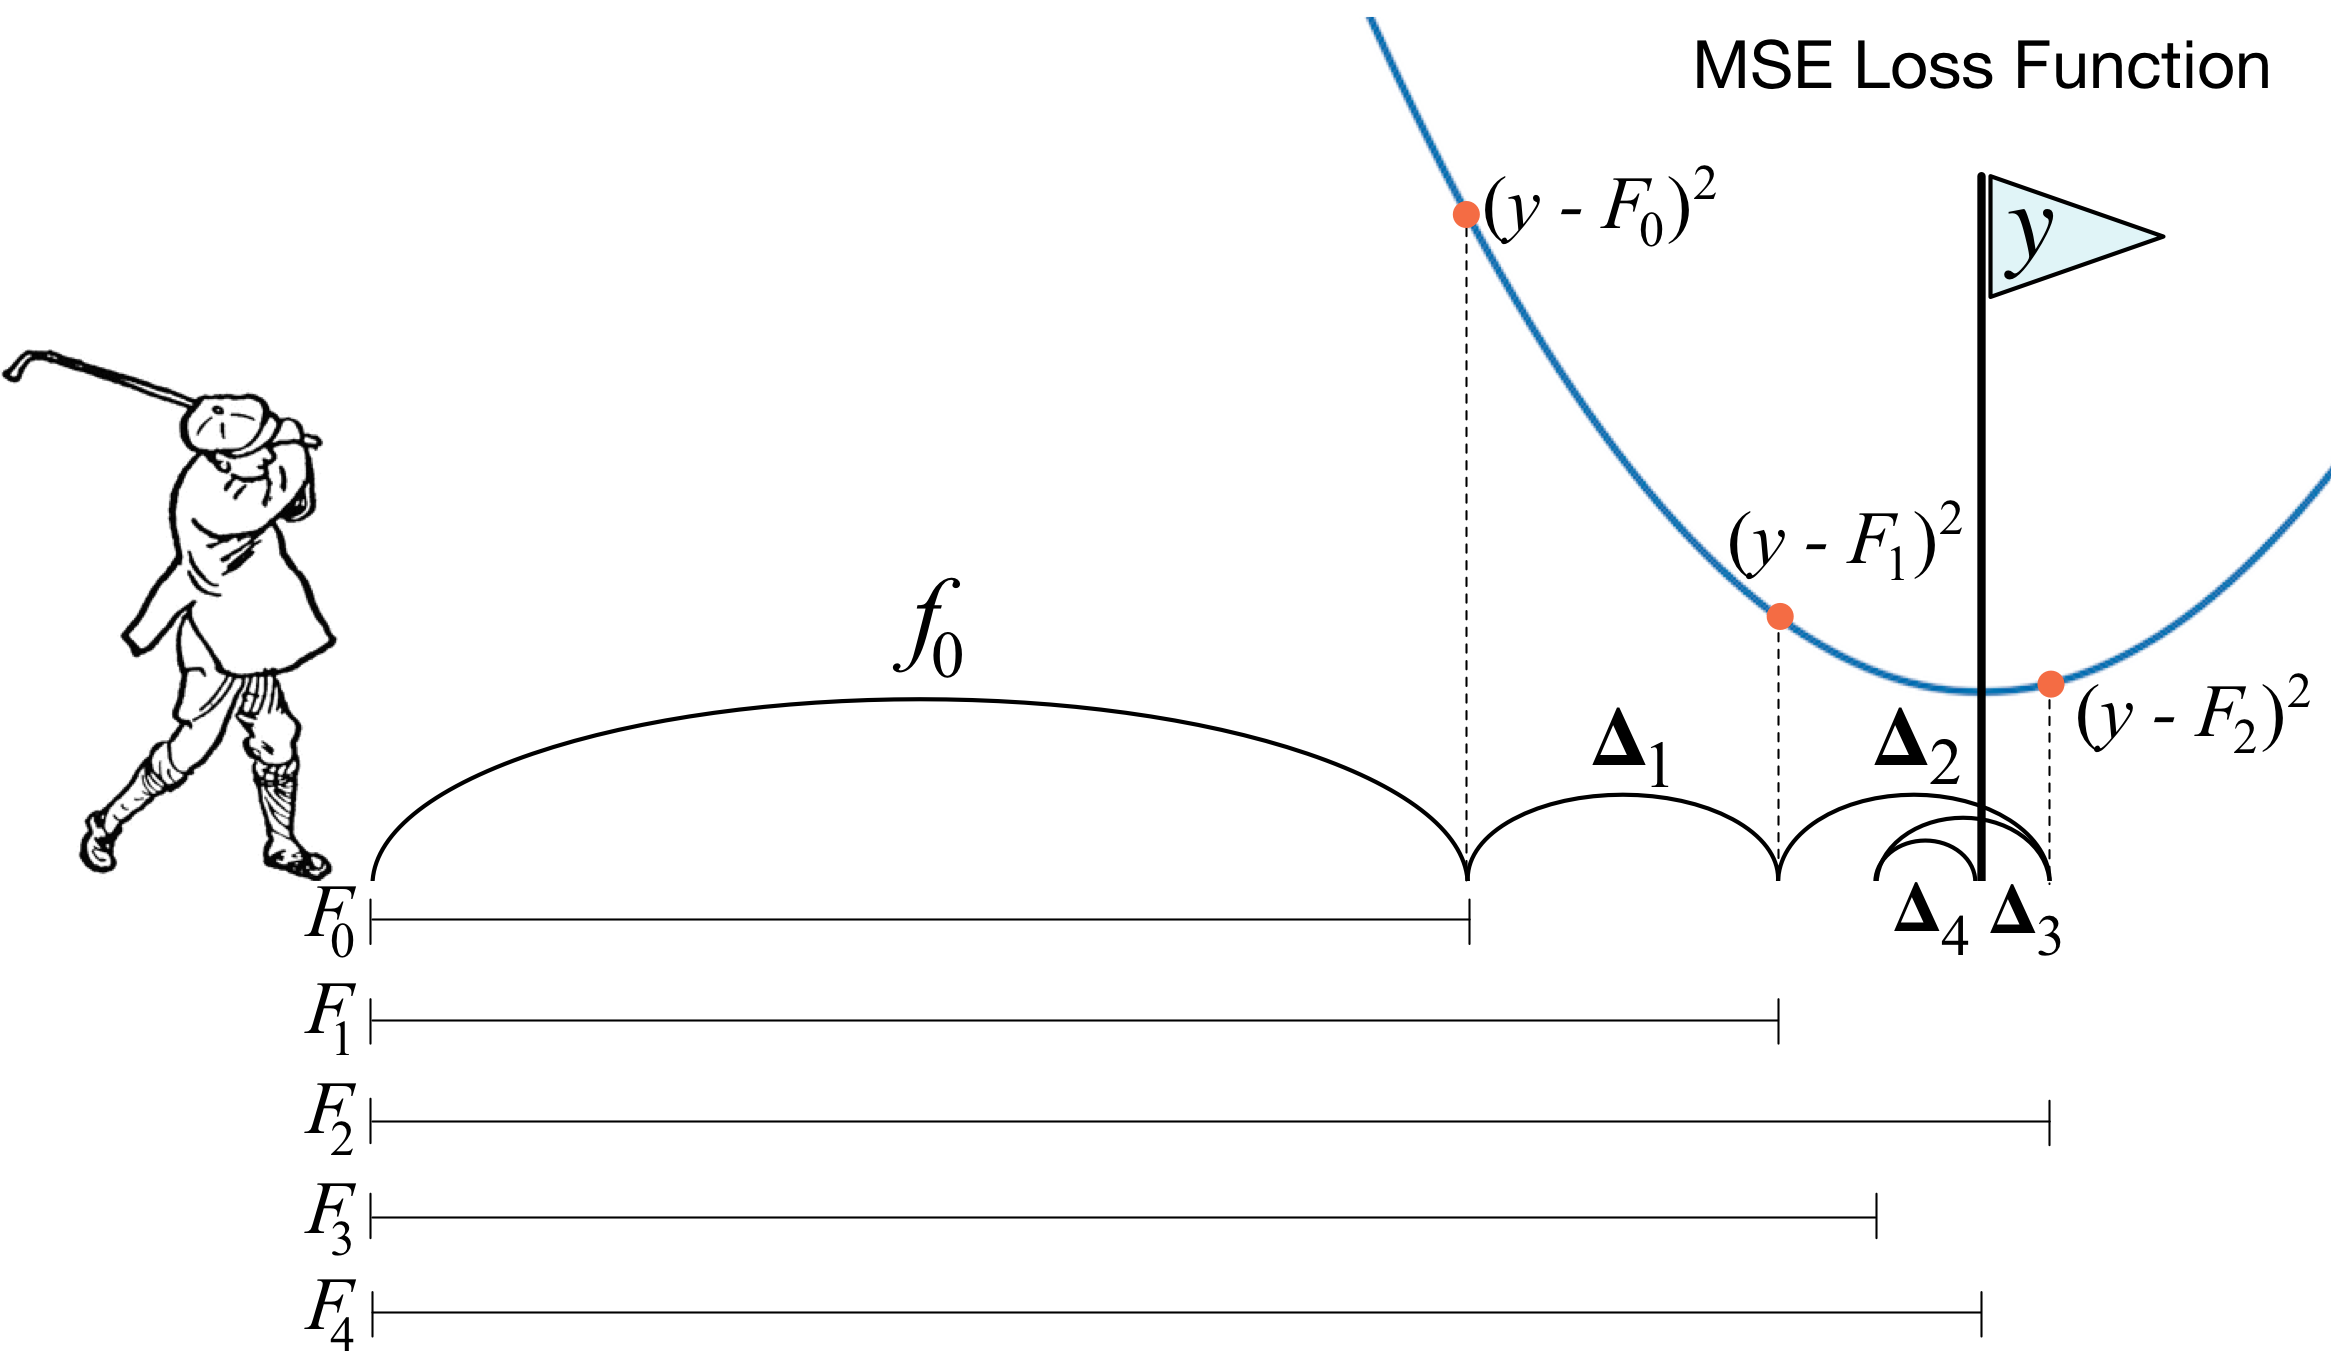
Gradient Boosting Machines (GBM)
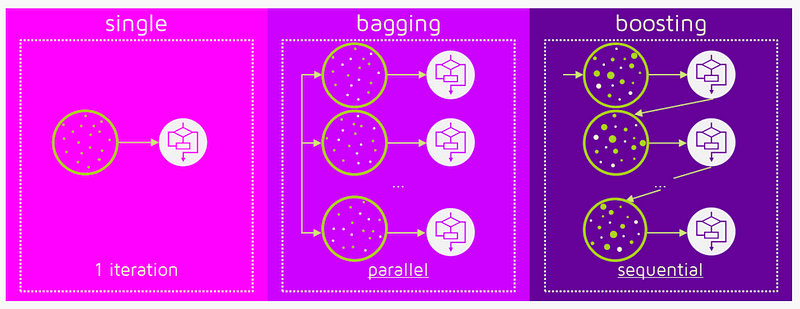
Difference between Bagging and Boosting
Difference Between RF and GBM
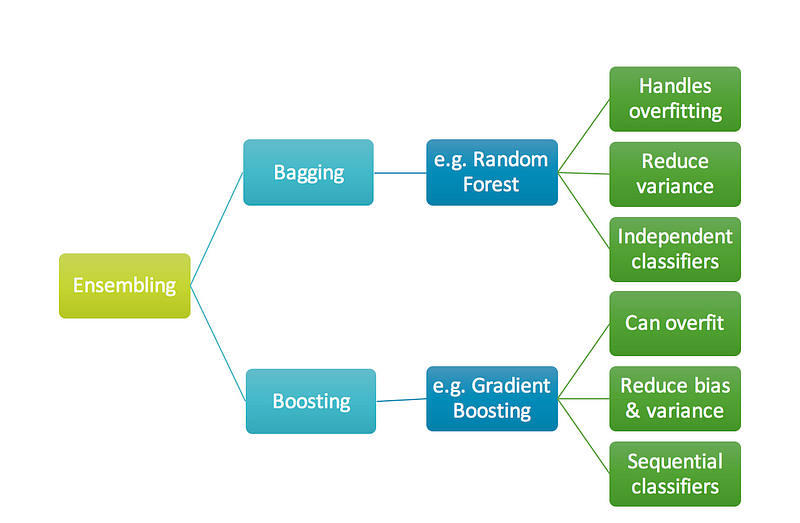
Similarity between RF and GBM
- Both are ensemble methods to get N learners from 1 learner
- Both generate several training data sets by random sampling…
- Both make the final decision by averaging the N learners (or taking the majority of them)…
- Both are good at reducing variance and provide higher stability…
Difference between RF and GBM
- but, while they are built independently for Bagging, Boosting tries to add new models that do well where previous models fail.
- but only Boosting determines weights for the data to tip the scales in favor of the most difficult cases.
- but it is an equally weighted average for Bagging and a weighted average for Boosting, more weight to those with better performance on training data.
- but only Boosting tries to reduce bias. On the other hand, Bagging may solve the over-fitting problem, while Boosting can increase it.


In [33]:
from sklearn.ensemble import GradientBoostingClassifier,GradientBoostingRegressor
from sklearn.datasets import load_boston,load_wine
import pandas as pd
from sklearn.model_selection import train_test_split
import matplotlib.pyplot as plt
from sklearn import metrics
import math
import numpy as np
In [9]:
def rmse(x,y): return math.sqrt(((x-y)**2).mean())

def print_score(m):
    res = [rmse(m.predict(X_train), y_train), rmse(m.predict(X_test), y_test),
                m.score(X_train, y_train), m.score(X_test, y_test)]
    if hasattr(m, 'oob_score_'): res.append(m.oob_score_)
    print(res)
In [4]:
gbc=GradientBoostingRegressor()
In [54]:
gbc.get_params()
Out[54]:
In [55]:
house_price=load_boston(return_X_y=False)
#house_price['data']
#house_price['feature_names']
#house_price['target']
X_df=pd.DataFrame(data=house_price['data'],columns=house_price['feature_names'])
y=house_price['target']
X_df.head(10)
Out[55]:
In [57]:
X_train, X_test, y_train, y_test=train_test_split(X_df,y)
In [58]:
m=GradientBoostingRegressor(n_estimators=10)
m.fit(X_train, y_train)
print_score(m)
In [59]:
m.estimators_[5][0]
Out[59]:
In [61]:
preds = np.stack([t[0].predict(X_test) for t in m.estimators_])
preds[:,0], np.sum(preds[:,0]), y_test[0]
Out[61]:
In [62]:
pred=m.predict(X_test)
plt.plot(y_test,label='orig')
plt.plot(pred,label='pred')
plt.legend()
plt.show()

In [63]:
pred[0]
Out[63]:
In [26]:
import pydotplus
from sklearn.tree import export_graphviz
from IPython.display import Image,HTML,SVG

from io import StringIO
dot_data = StringIO()
export_graphviz(m.estimators_[0][0], out_file=dot_data,
                filled=True, rounded=True,
                special_characters=True,feature_names=house_price['feature_names'])
graph = pydotplus.graph_from_dot_data(dot_data.getvalue())
#Image(graph.create_png())
import os
import sys
def conda_fix(graph):
        path = os.path.join(sys.base_exec_prefix, "Library", "bin", "graphviz")
        paths = ("dot", "twopi", "neato", "circo", "fdp")
        paths = {p: os.path.join(path, "{}.exe".format(p)) for p in paths}
        graph.set_graphviz_executables(paths)
conda_fix(graph)
Image(graph.create_jpg())
Out[26]:

In [49]:
from io import StringIO
dot_data = StringIO()
export_graphviz(m.estimators_[1][0], out_file=dot_data,
                filled=True, rounded=True,
                special_characters=True,feature_names=house_price['feature_names'])
graph = pydotplus.graph_from_dot_data(dot_data.getvalue())
#Image(graph.create_png())
import os
import sys
def conda_fix(graph):
        path = os.path.join(sys.base_exec_prefix, "Library", "bin", "graphviz")
        paths = ("dot", "twopi", "neato", "circo", "fdp")
        paths = {p: os.path.join(path, "{}.exe".format(p)) for p in paths}
        graph.set_graphviz_executables(paths)
conda_fix(graph)
Image(graph.create_jpg())
Out[49]:

In [50]:
from io import StringIO
dot_data = StringIO()
export_graphviz(m.estimators_[2][0], out_file=dot_data,
                filled=True, rounded=True,
                special_characters=True,feature_names=house_price['feature_names'])
graph = pydotplus.graph_from_dot_data(dot_data.getvalue())
#Image(graph.create_png())
import os
import sys
def conda_fix(graph):
        path = os.path.join(sys.base_exec_prefix, "Library", "bin", "graphviz")
        paths = ("dot", "twopi", "neato", "circo", "fdp")
        paths = {p: os.path.join(path, "{}.exe".format(p)) for p in paths}
        graph.set_graphviz_executables(paths)
conda_fix(graph)
Image(graph.create_jpg())
Out[50]:

In [53]:
from io import StringIO
dot_data = StringIO()
export_graphviz(m.estimators_[9][0], out_file=dot_data,
                filled=True, rounded=True,
                special_characters=True,feature_names=house_price['feature_names'])
graph = pydotplus.graph_from_dot_data(dot_data.getvalue())
#Image(graph.create_png())
import os
import sys
def conda_fix(graph):
        path = os.path.join(sys.base_exec_prefix, "Library", "bin", "graphviz")
        paths = ("dot", "twopi", "neato", "circo", "fdp")
        paths = {p: os.path.join(path, "{}.exe".format(p)) for p in paths}
        graph.set_graphviz_executables(paths)
conda_fix(graph)
Image(graph.create_jpg())
Out[53]:
